What is a Tableau Funnel Chart?
A tableau funnel chart is a type of visualization that represents linear workflows in decreasing order. It visually represents the progression of a business process and helps the user get a systematic view of various data values.
Tableau funnels are a great way to identify various bottlenecks and track the progress of your business in multiple steps. There are mainly two types of Tableau pipeline visualizations or funnel charts:
- Stepped funnel chart: Stepped funnel represents the workflow in boxed format and is easy to create.
- Smooth funnel chart: Smooth or advanced funnel charts represent the information in a more interactive way. However, you’ll need a calculated field to create an advanced tableau funnel chart.
Now, let’s discuss how to make a funnel chart in tableau using a Sample_ Superstore dataset provided by tableau.
Check out the Tableau interview questions if you’re preparing for a job interview.
How to create a Funnel Chart in Tableau?
Follow the steps to create a sales funnel tableau chart using the dataset mentioned above:
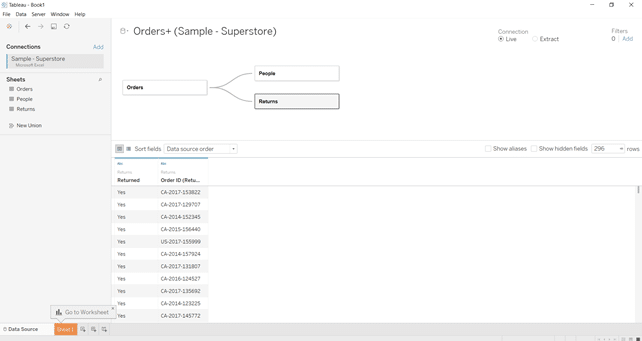
- Step 1. Open your Tableau desktop software and select Microsoft Excel as your dataset.
- Step 2. Load the sample_Superstore file, create relationships between the tables, and move on to the Worksheet.
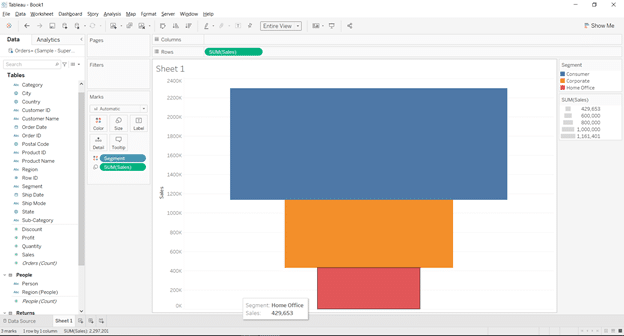
- Step 3. Now, add the Sales dimension to the Row section and the Segment to the Color in the Marks section.
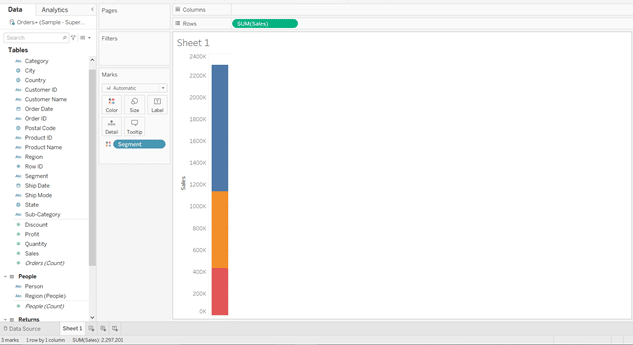
- Step 4. Now, drop the Sales dimension in the Size field of the Marks section. The Size field will convert the visualization into variable-sized blocks based on the Sales value.
- Step 5. In the toolbar, click on the highlighted dropdown menu and click on ‘Entire View’.
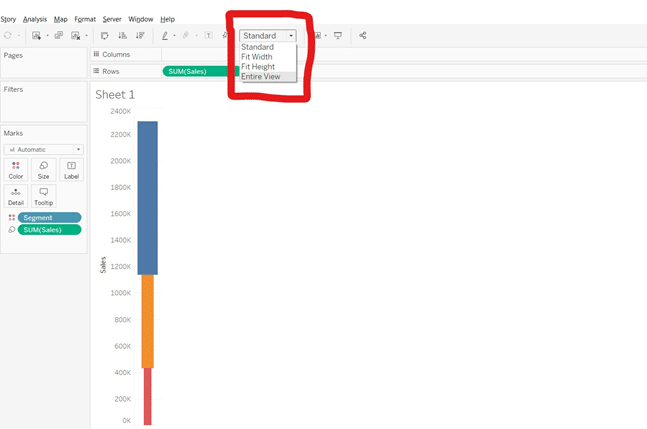
- Step 6. The funnel will appear on the entire worksheet of your Tableau Desktop.
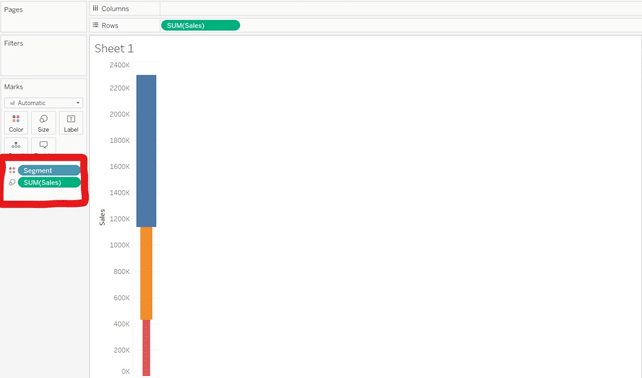
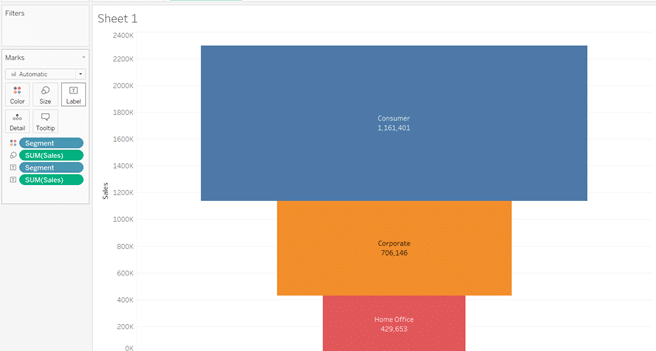
- Step 7. Add both the Segment and Sales dimensions as labels in the Marks dimension. Now, each box in the funnel chart will display its segment along with the sales.
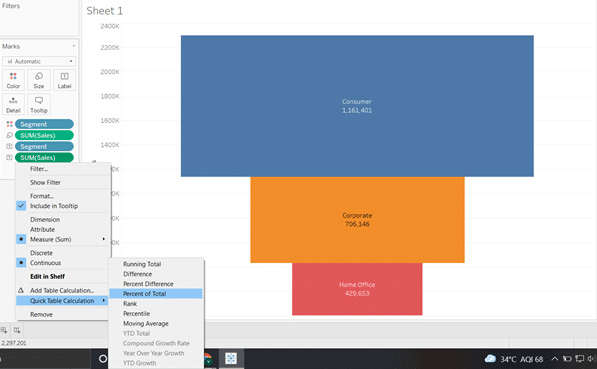
- Step 8. As shown in the above screenshot, the profit displayed by our funnel chart is in the form of numbers. But, what if you want to display it in a different format like the percentage, rank, moving average, or more? For that, you need to go to the Sales dropdown menu>> Quick Table Calculation and the format.
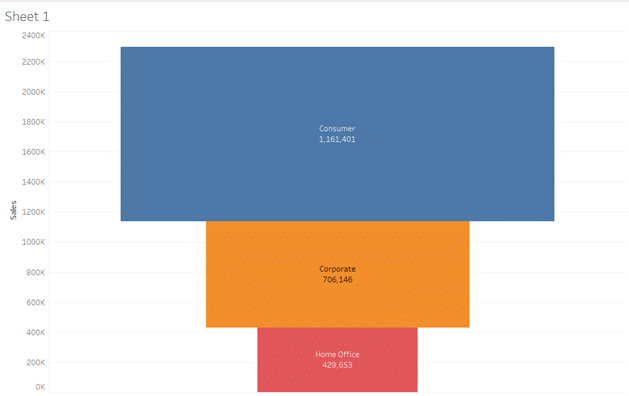
- Step 9. For demonstration, we’ve selected the Percent of Total format and the resulting funnel, and the Sales label was changed to percentage.
- Step 10. Here the label font size is very small, which makes it harder for the user to read profit and other numeric values. You can change the label font size and color from the format options in the dropdown menu.
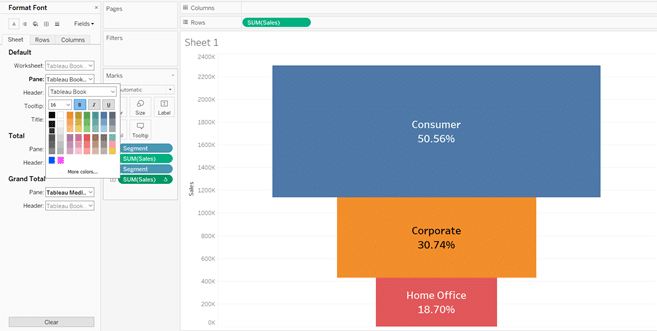
- Step 11. You can also change the color of your labels from the same Format font menu and play around with other options.


No comments:
Post a Comment